Grow Your Affinity for PMP Planning Tools
PMP Certification | Project Management
Project Management Professional® (PMP) holders know it is a data-driven world. They also know data thrown at them for a project, or the data collected during a project is not always immediately clear nor easy to connect to project work. Using tools like an affinity diagram, can not only solve an immediate data problem but can also build teams through the collaborative process to create it.
Unlock your earning potential, download 8 Secrets to Passing the PMP Exam.
What is an Affinity Diagram
The term “affinity diagram” is what it sounds like – a diagram reflecting an affinity (connection) among information sets. The affinity diagram, defined in the 6th edition of the Project Management Body of Knowledge (PMBOK® Guide), page 144, is also one of the Seven Management and Planning Tools used by project managers to organize, analyze and prioritize ideas and tasks.

Those with Project Management Professional® (PMP) credentials know affinity diagrams; those working to expand their project management toolset or preparing for the PMP exam need to know the definition and uses of the affinity diagram. In the context of the PMP exam, affinity diagrams are used to:
- group data gathered during research or ideas generated during brainstorming sessions
- organize an unsorted or unorganized list of data to add structure
- stimulate new patterns of thinking sparked by groups formed during the affinity method process
As project managers find themselves with the expectation to create new solutions from large data sets, the affinity diagram can be very helpful.
Examples of Affinity Diagrams
Whether you are working on a virtual team using technology to collaborate or an onsite team that can leverage large planning areas, an affinity diagram is a tool that can benefit projects of all types.
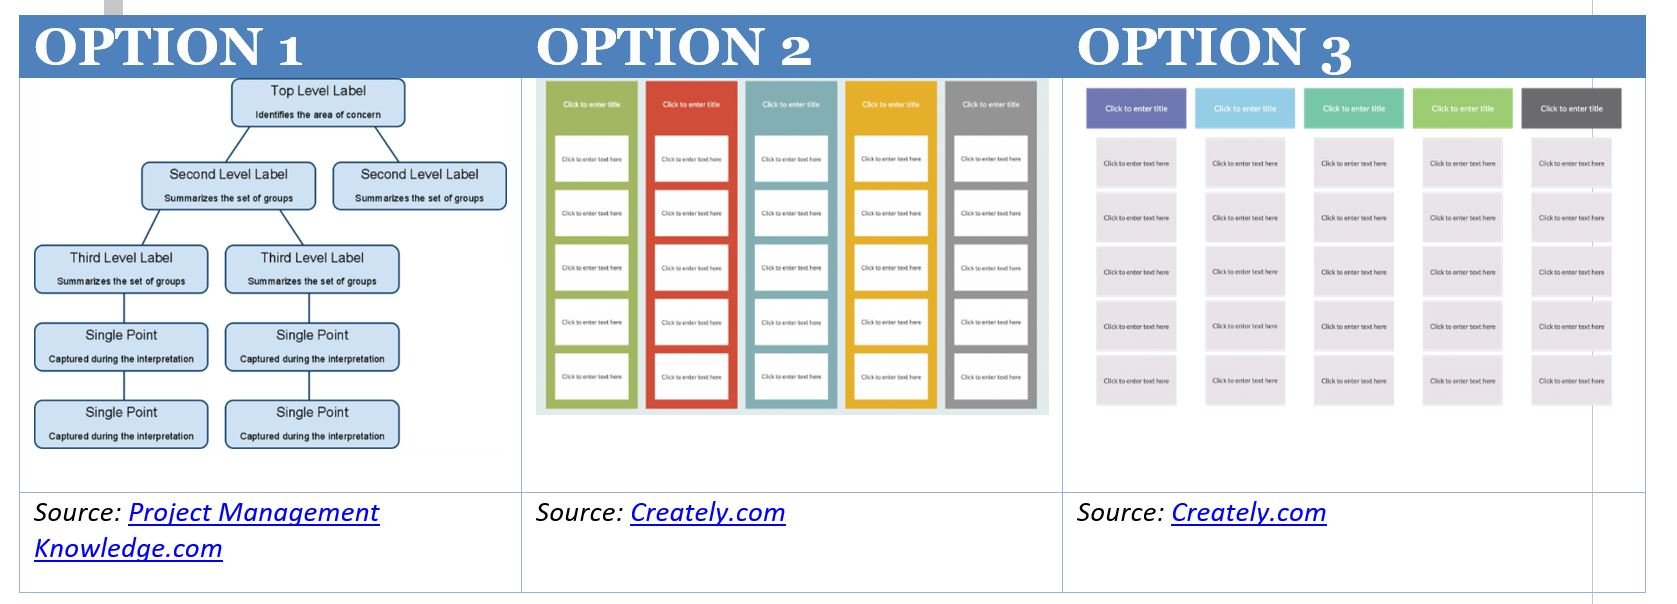
Keeping in mind that an affinity diagram is a tool used to “create clarity during the thought processes thereby creating novel patterns of thinking,” which of these diagrams is an affinity diagram?

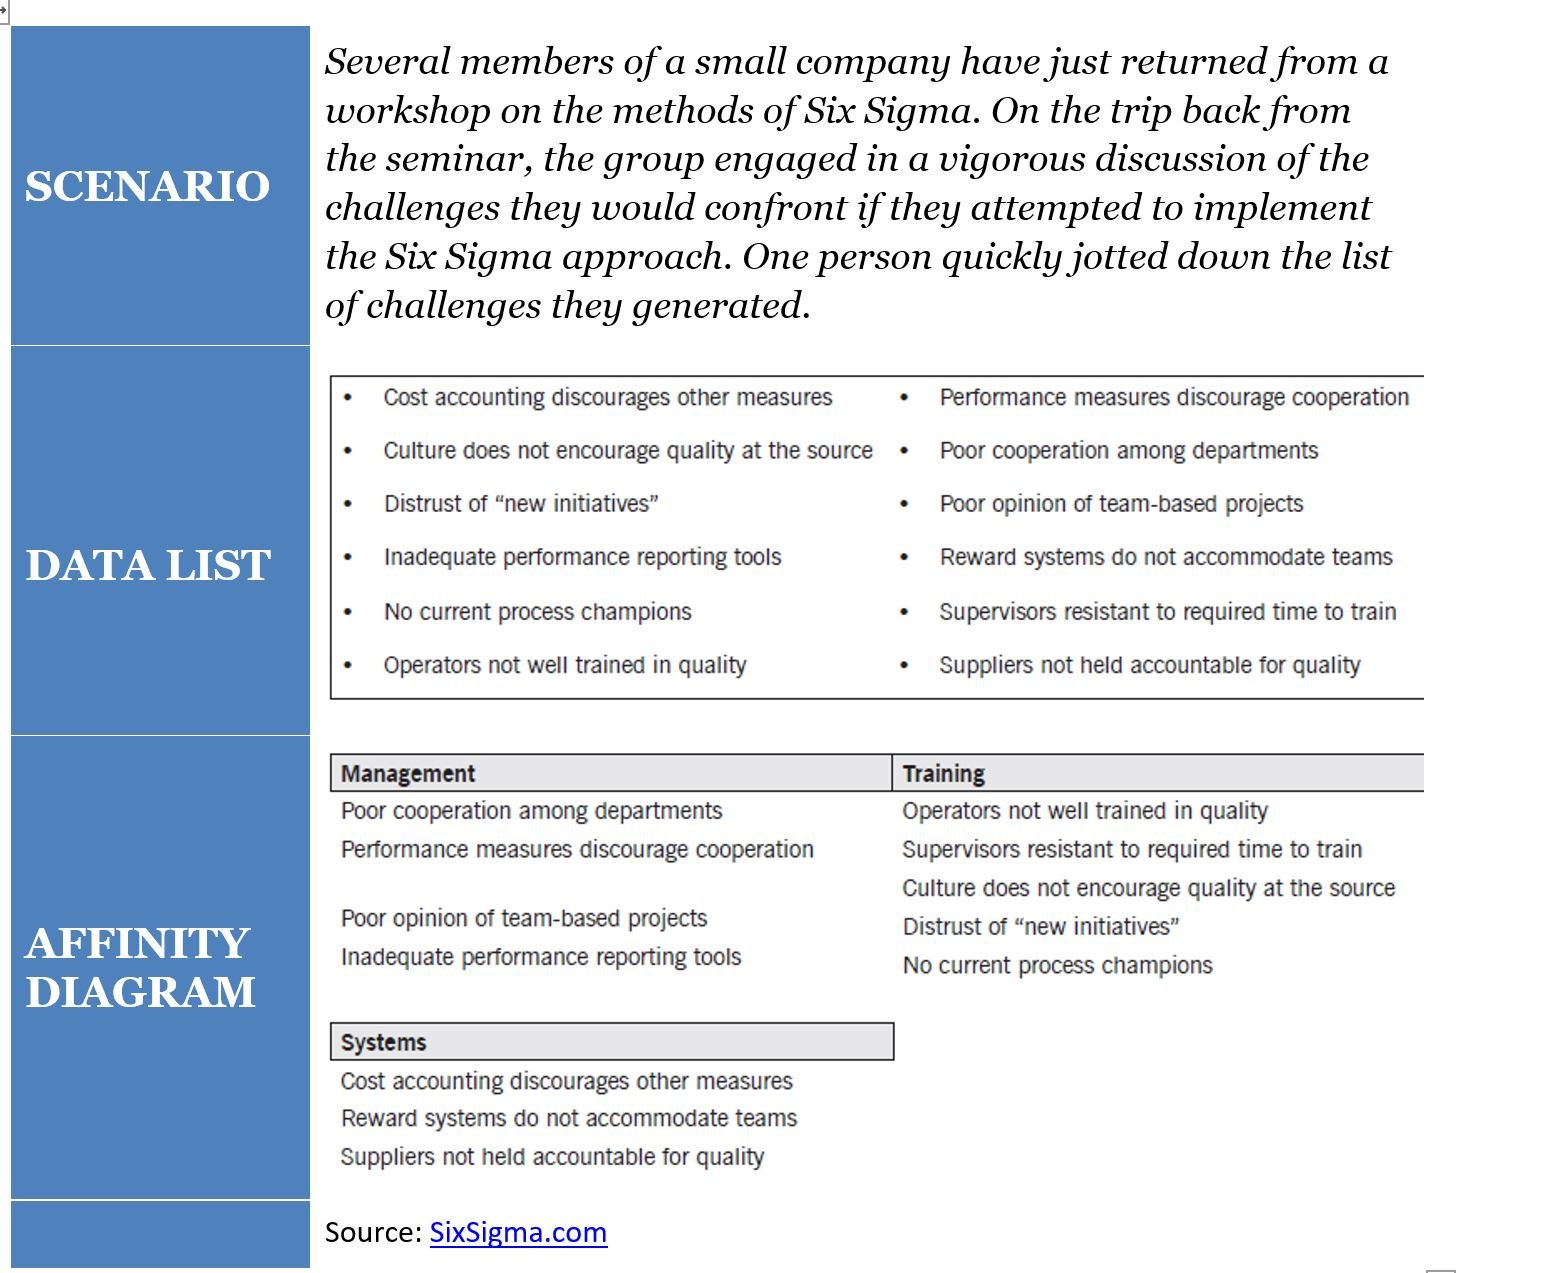
Each of the shown options is an example of how data can be diagramed to convey themes or affinity. For an affinity diagram example, the Six Sigma.com site shares this:

Each example diagram looked a little bit different but achieved the same result: clarity from seemingly unrelated data. When using an affinity diagram in project environments, complicated software is not required. What is required is the ability to collect data and organize it in such a way as to discover hidden themes which can enable the team to find new opportunities or solutions. This is a key point to remember for the PMP exam.
Affinity Diagrams in Context of the PMP Exam
Credited to Jiro Kawakita, the Seven Management and Planning Tools include:
- process decision program chart
- arrow diagram
- matric data analysis
- matrix diagrams
- tree diagram
- interrelationship diagram
- affinity diagrams
When preparing for the PMP exam, the project manager should know of the Seven Management and Planning Tools and for each, the definition, how it is used in project planning, how it is created, and when to use it.
The affinity diagram, also known as the K-J method due to its creator, “is an analytical tool used to organize many ideas into subgroups with common themes or common relationships.” It is used when there is a seemingly incoherent collection of data that needs to be organized so those insights can be applied to planning. It is created through the systematic labeling and organization of data into specific categories.
When the PMP holder uses an Affinity Diagram
In this example from the Project Management Institute® (PMI) library, the PMI credential holder guides the team through the affinity diagram process to get to needed insights:
For example, when identifying project risks, each team member will write individual risk events on sticky notes (one risk per sticky note). The team members will then place the risk events into groupings of like items until there is consensus. This process takes place in complete silence. After final groupings are established, the participants name each grouping of risk events.
Each tool serves a purpose. The affinity diagram can help the team find patterns in data; the organization process of the data can help the project manager find answers for questions such as:
Project managers and PMP credential holders can use the affinity diagram process and resulting graphic to:
- Find creative solutions to difficult problems by involving people from diverse fields
- Sort through large volumes of confusing data and in a logical, easy-to-understand manner
- Generate discussions leading to innovation/ effective solutions
- Present analysis in an easy-to-understand manner
One reason the affinity diagram is so useful is it can be used in almost any project setting with large amounts of data needing to be organized. The process of creating the diagram provides insights as does the final diagram.
How to create an Affinity Diagram
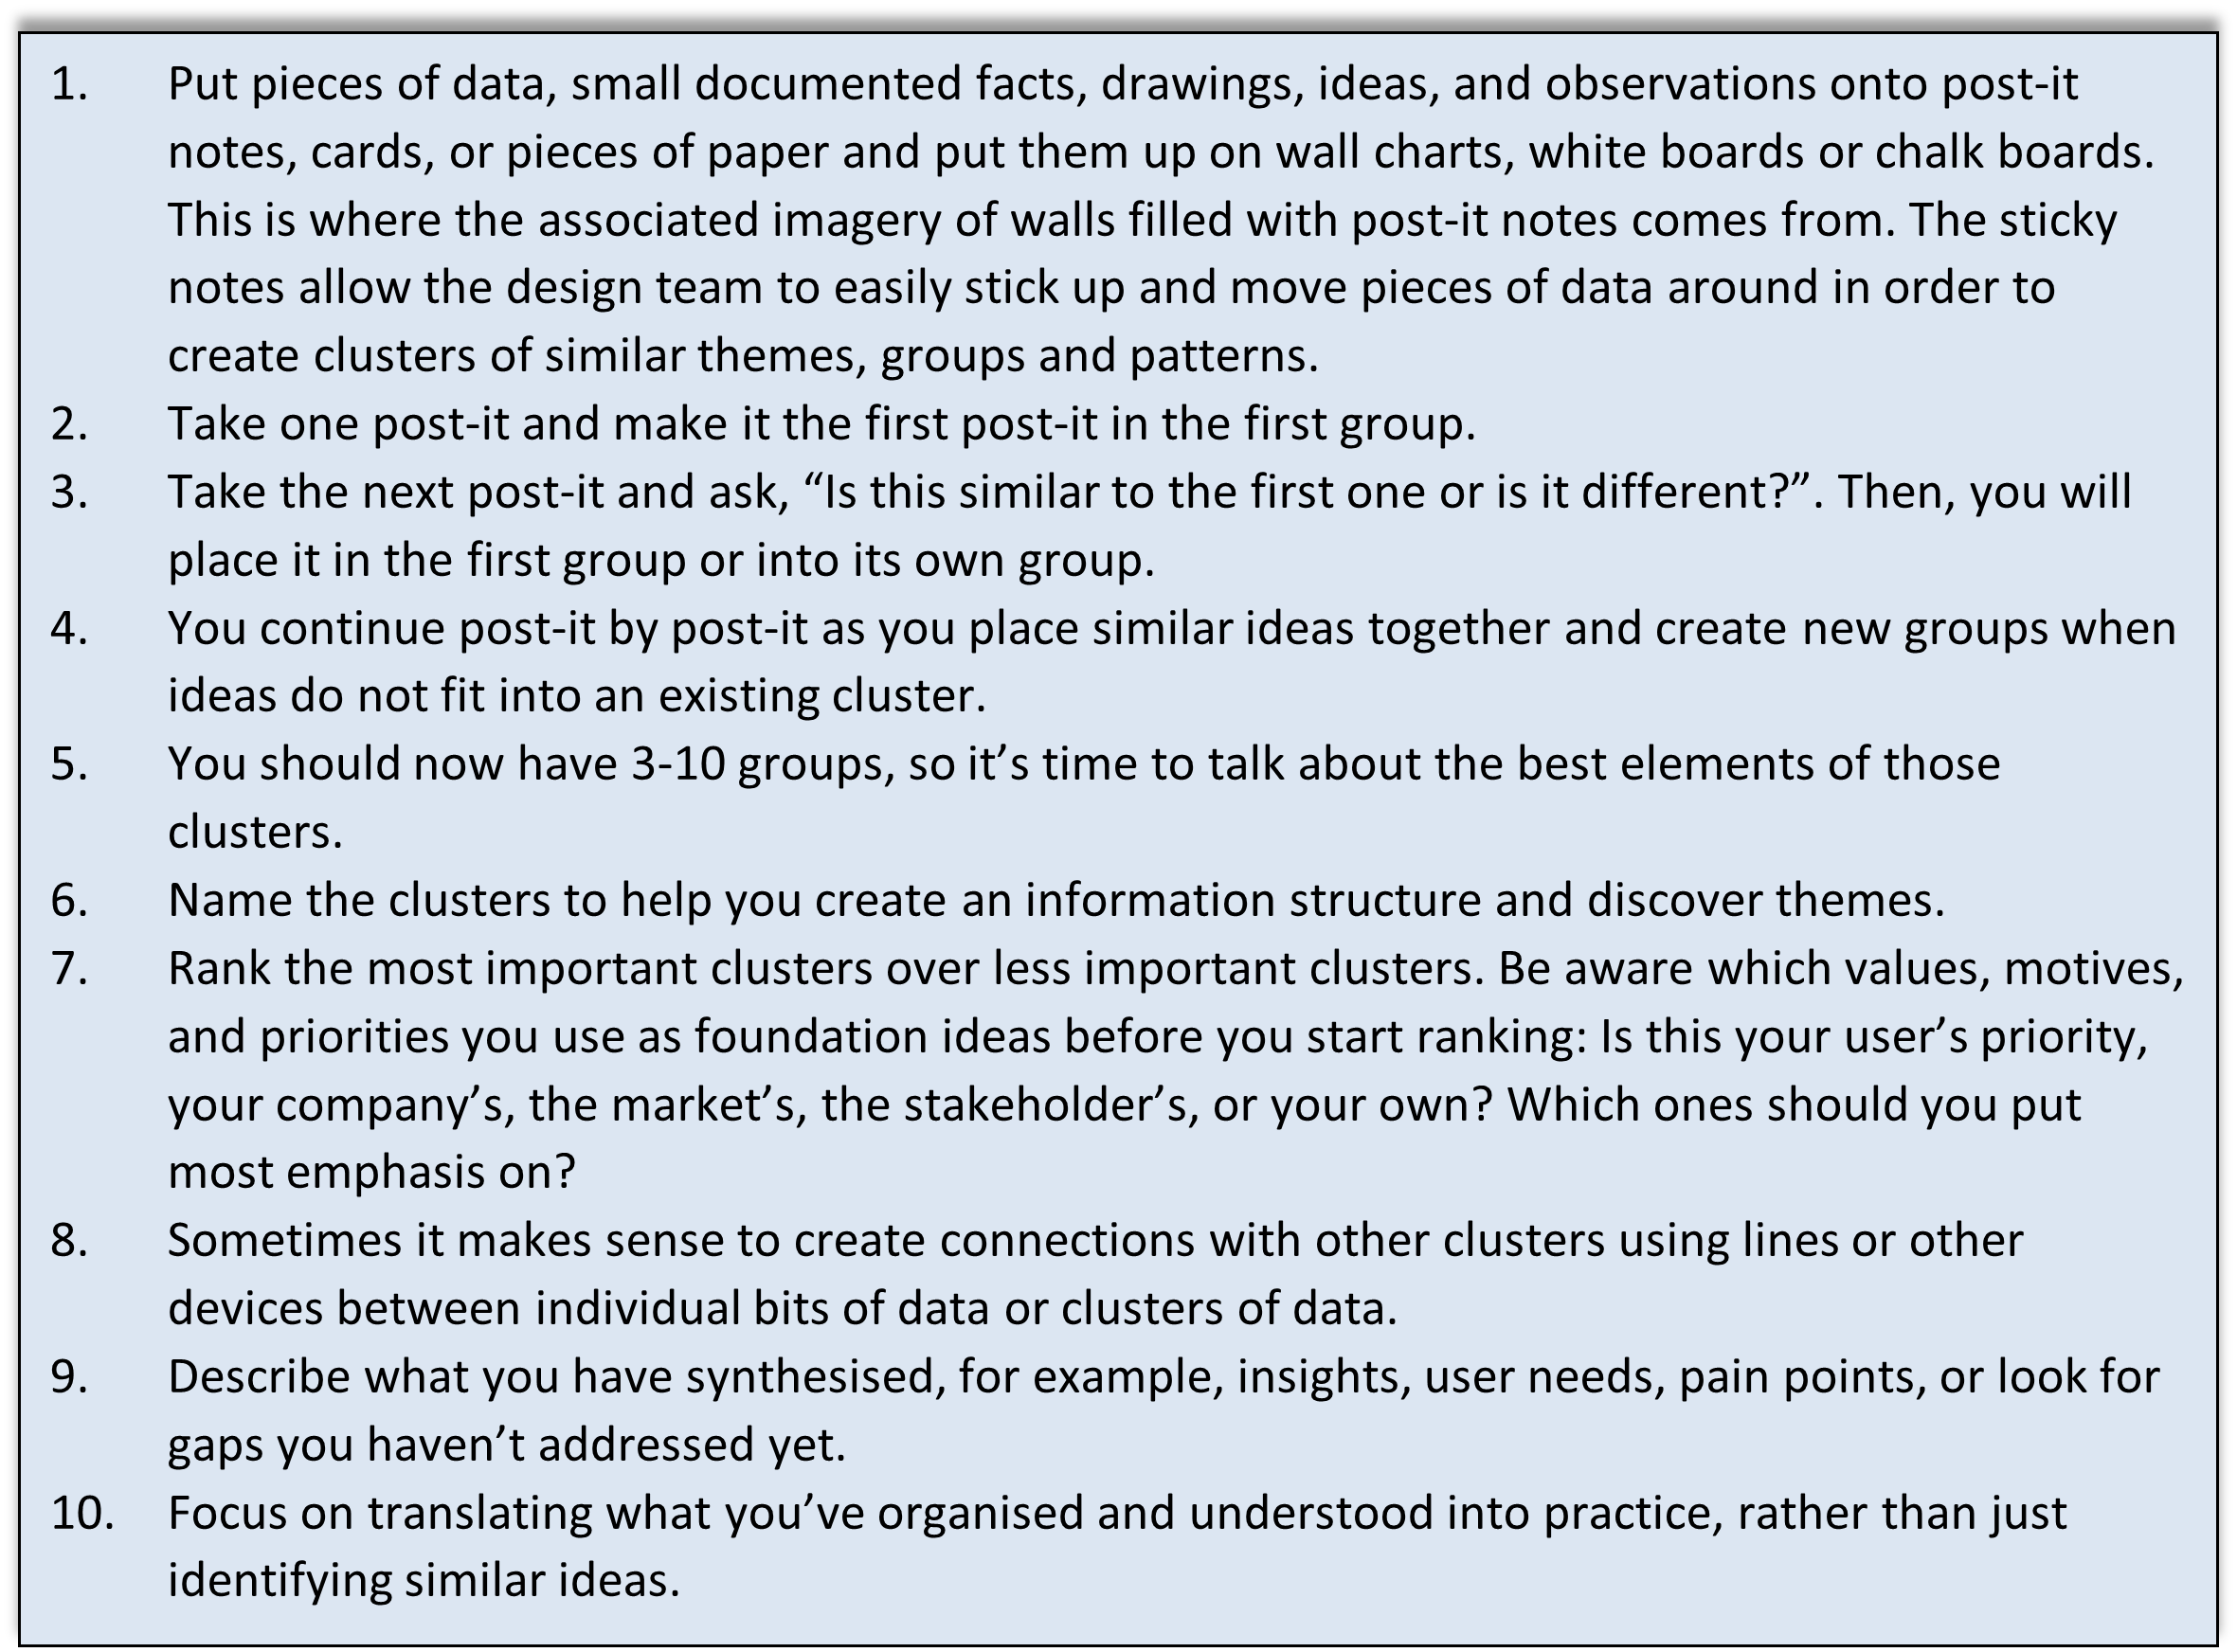
Whether using Google JamBoard online or Post-Its ® in a conference room, a project manager can follow key steps to guide the team through the creation of an affinity diagram. Here is a ten-step instruction list from Interaction-Design.com that guides the project manager through the process:

The organizing of information should be conducted by participants who have different backgrounds so that the connection points within the data bubble to the surface organically. Those outside of project management or project managers who have not yet earned their PMP can easily use the process.
Affinity Diagrams
In addition to organizing project-related data to discover powerful themes, the affinity diagram is “frequently used in contextual inquiry as a way to organize notes and insights from field interviews” and for “organizing other freeform comments, such as open-ended survey responses, support call logs, or other qualitative data.” Project managers with or without the PMP should develop a fondness for the affinity diagram due to its many uses.
About Megan Bell, MPM, PMP
A multi-hyphenate of corporate training, higher education, and creative agency work, Bell’s passion for connecting people to impactful information fuels an evolving career journey. Her portfolio includes conducting learning analytic research and reporting, managing a corporate mentoring program, authoring a blog series, facilitating leadership and career programs, serving on a non-profit board, and even occasional voice work. Bell’s education background encompasses UNC-Chapel Hill, Western Carolina University, and North Carolina State University.


