


Project Management | PMP Exam Prep
A matrix diagram for the Project Management Professional® (PMP) holder is one of the Seven Quality Tools used for data collection and analysis. It is the arrangement of data in the matrix diagram that reveals “the strength of relationships between factors, causes, and objectives.” It is also an important concept that could be asked about on the PMP exam. Knowledge of the matrix diagram for the PMP exam encompasses (1) knowing how to use it on the job as a project manager and (2) understanding its value as a quality tool for the exam.
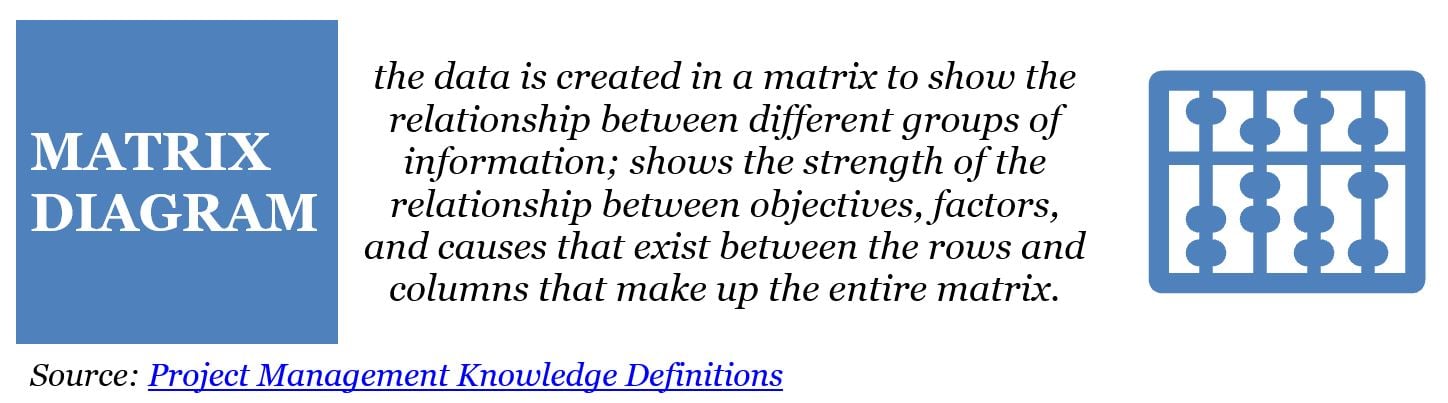
What is a matrix diagram
The power of the matrix diagram is showing not only the relationship between variables but the strength of that relationship. The matrix diagram is a planning and decision-making tool that can be used in any industry.
In this example of a matrix diagram, note the placement of data in cells as organized into rows and columns. Patterns emerge organically and should not be forced.
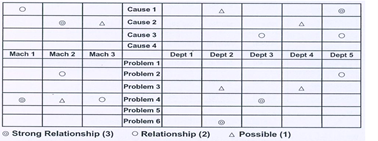
Figure 1 https://isoconsultantkuwait.com/2020/10/17/the-seven-new-management-and-planning-tools/#4
The American Society for Quality describes the quality matrix diagram as a tool used for analyzing and displaying the relationship between two, three, or four groups of information. It is important to note the matrix diagram may also be called a matrix or matrix chart.
Steps to create a matrix diagram
To create a quality matrix diagram, PMP credential holders need to know the process behind this planning tool. The Six Sigma Study Guide is just one place where the process for matrix diagram creation is provided:

Figure 2 Six Sigma Study Guide
Software is available to create matrix diagrams based on the system’s evaluation of the data submitted. Yet that software does not tell the PMP credential holder what the diagram means nor how to interpret the data. The project manager who earns their PMP should know the process behind matrix diagrams to maximize the use of this quality tool.
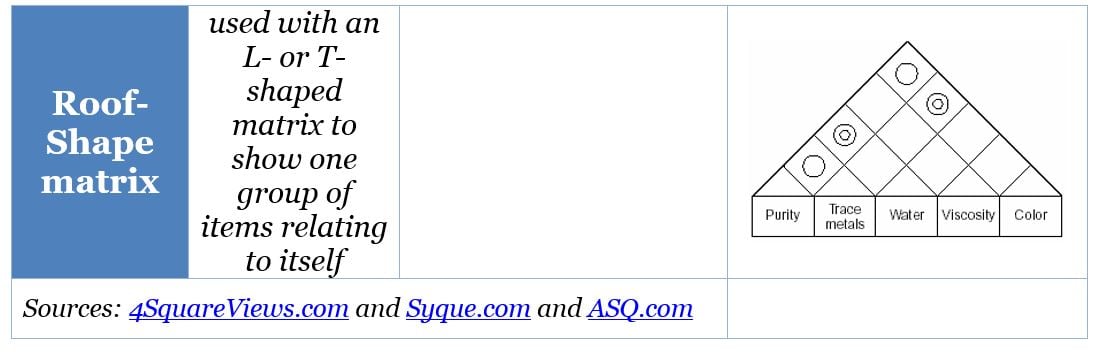
Types of matrix diagrams
The number of elements being compared will determine which of the six matrix diagrams to use: L-shaped, Y-shaped, C-shaped, T-shaped, X-shaped, and roof-shaped. For all types of matrix, the project manager can “easily visualize the relationship between objectives, factors, and causes within the organization they are observing.”
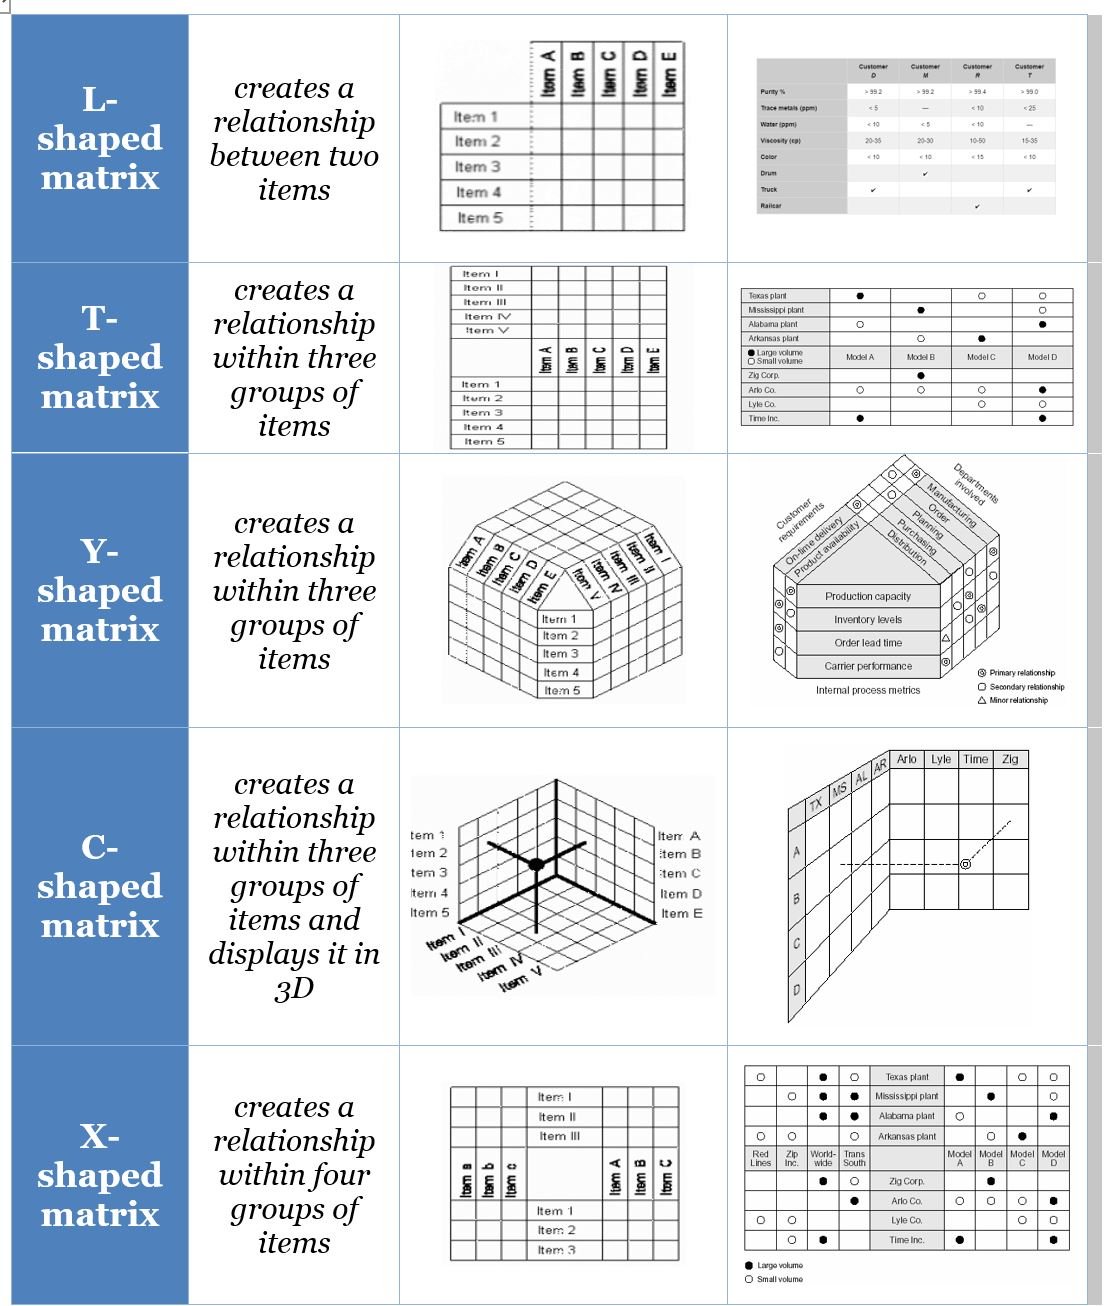
As seen in the provided examples, the matrix diagram tool can depict complex interrelationships among data sets with one, two, or three sets of variables.
Matrix Diagrams in context of the PMP exam
On the PMP exam, it is a tool to better understand the variables in a relationship in which data is available and decisions are needed. The matrix diagram for the PMP credential holder is defined in the 6th edition of the Project Management Body of Knowledge® (PMBOK® Guide), page 284. The uses of the matrix diagram for the PMP are the same as these examples of the tool from a Six Sigma process perspective:
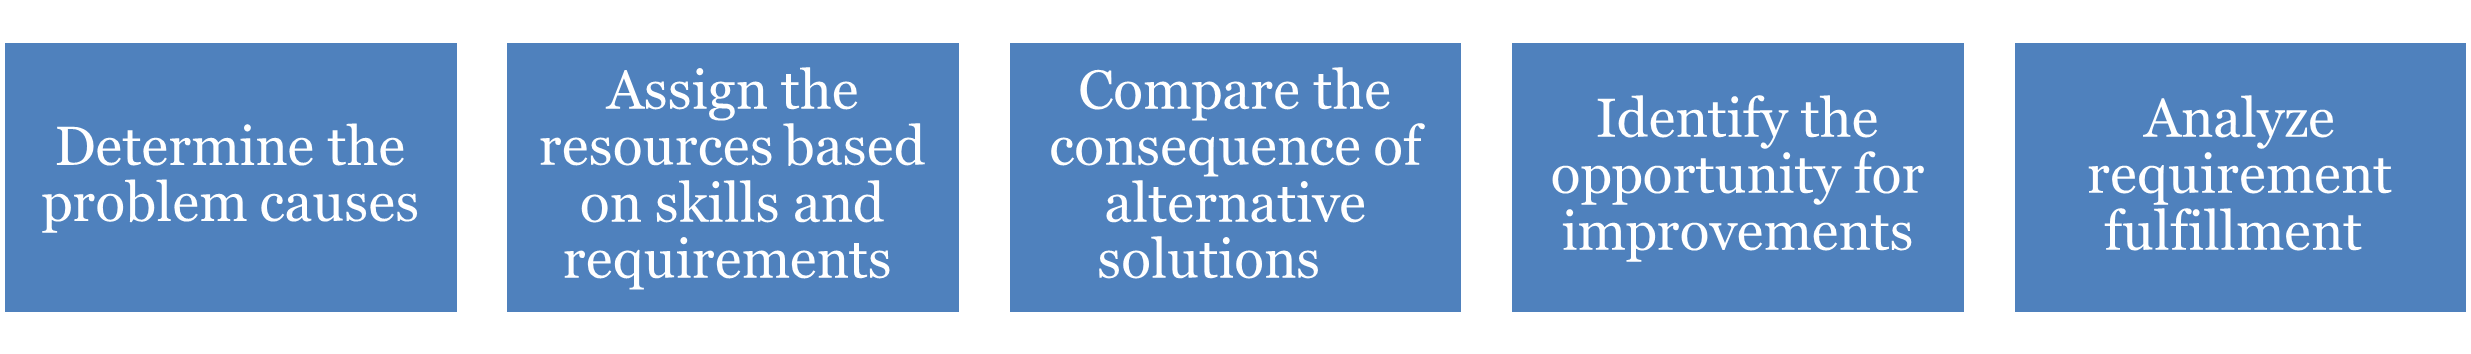
Project Managers can use a matrix to analyze information of many types, for example:
|
|
|
When studying a matrix diagram, you should be able to identify the type (L-shaped, Y-shaped, C-shaped, T-shaped, X-shaped, and roof-shaped ), when that type is used (how many data sets), and potential applications (identifying root causes, comparing solutions, matching requirements with specifications).
PMP credential holders need to know that a matrix is not always used as a diagram. It can be a matrix chart or document. What matters is the relationship between data is captured and analyzed. For example:
Requirements Traceability Matrix (RTM)
A document capturing the relationship between requirements and other factors; used by project managers to document requirements, tests, and issues.
Power or Influence Matrix
A document detailing the power or influence of a stakeholder on a specific project; used by project managers as part of stakeholder management.
Stakeholder Engagement Assessment Matrix
A chart with data on stakeholder engagement levels for a specific project; project managers can use it to identify potential gaps and know where intervention may be needed.
A matrix document helps the project manager track data among one, two, or four types of data; the diagram can help the project manager understand causal relationships among the data sets. It does not need to be complicated; in fact, keeping the data clean and organized is the intent.
Matrix diagram
Project managers can use the quality tools in any industry, from the product development phase until delivery, and in phases of Six Sigma and Lean management. A matrix diagram is a quality tool that uses data representation to find the strength of the relationship among various factors, causes, and objectives. Whether using a matrix diagram or a matrix document, the project manager is analyzing project data to improve a process, solve a problem, or make a decision.